Troubleshooting guide
Troubleshooting Kubeadm
For a complete guide to troubleshooting kubeadm, click here.
Connecting to internal databases
- TimescaleDB
Start a bash session within the timescaledb pod:
kubectl exec -it pod/timescaledb-0 -n telemetry-and-visualizations -- /bin/bashConnect to psql using the
psql -u <postgres_username>command.Connect to database using the
\c telemetry_metricscommand.
- MySQL DB
Start a bash session within the mysqldb pod using the
kubectl exec -it pod/mysqldb-0 -n telemetry-and-visualizations -- /bin/bashcommand.Connect to mysql using the
mysql -u <mysqldb_username>command and provide password when prompted.Connect to database using the
USE idrac_telemetrysource_services_dbcommand.
Checking and updating encrypted parameters
Move to the filepath where the parameters are saved (as an example, we will be using
provision_config_credentials.yml):cd input/
To view the encrypted parameters:
ansible-vault view provision_config_credentials.yml --vault-password-file .provision_credential_vault_key
To edit the encrypted parameters:
ansible-vault edit provision_config_credentials.yml --vault-password-file .provision_credential_vault_key
Checking pod status from the OIM
Use this command to get a list of all available pods:
kubectl get pods -ACheck the status of any specific pod by running:
kubectl describe pod <pod name> -n <namespace name>
Using telemetry information to diagnose node issues
Metric Name |
Unit |
Possible Values |
Possible error causes |
|---|---|---|---|
BlockedProcesses |
processes |
|
|
CPUSystem |
seconds |
|
|
CPUWait |
seconds |
|
|
ErrorsRecv |
|
|
|
ErrorsSent |
|
|
|
FailedJobs |
|
|
|
HardwareCorruptedMemory |
kB |
|
|
MemoryActive |
bytes |
|
|
MemoryAvailable |
bytes |
|
|
MemoryCached |
bytes |
|
|
MemoryFree |
bytes |
|
|
MemoryInactive |
bytes |
|
|
MemoryPercent |
percent |
|
|
MemoryShared |
bytes |
|
|
MemoryTotal |
bytes |
|
|
MemoryUsed |
bytes |
|
|
NodesDown |
|
|
|
NodesTotal |
|
|
|
NodesUp |
|
|
|
QueuedJobs |
|
|
|
RunningJobs |
|
|
|
SMARTHDATemp |
C |
|
|
UniqueUserLogin |
|
Metric Name |
Possible value(s) |
Possible failure causes |
|---|---|---|
dmesg |
|
|
beegfs -beegfsstat |
|
|
gpu_driver_health:gpu |
|
|
gpu_health_nvlink:gpu [1] |
|
|
gpu_health_pcie:gpu |
|
|
gpu_health_pmu:gpu |
|
|
gpu_health_power:gpu |
|
|
gpu_health_thermal:gpu |
|
|
Kubernetespodsstatus |
|
|
Kuberneteschildnode |
|
|
kubernetesnodesstatus |
|
|
kubernetescomponentsstatus |
|
|
Smart |
|
|
Metric Name |
Unit |
Possible value(s) |
Potential error cause(s) |
|---|---|---|---|
gpu_temperature:gpu |
C |
|
|
gpu_utilization |
percent |
|
|
gpu_utilization:average |
percent |
|
|
Troubleshooting image download failures while executing local_repo.yml playbook
If you encounter image download failures while executing local_repo.yml, do the following to resolve the issue:
Check if docker pull limit has been reached by manually trying to download an image. Provide docker credentials in
provision_config_credentials.ymland re-runlocal_repo.ymlplaybook. Else executenerdctl loginmanually.Run the following command:
systemctl status nerdctl-registryExpected output:
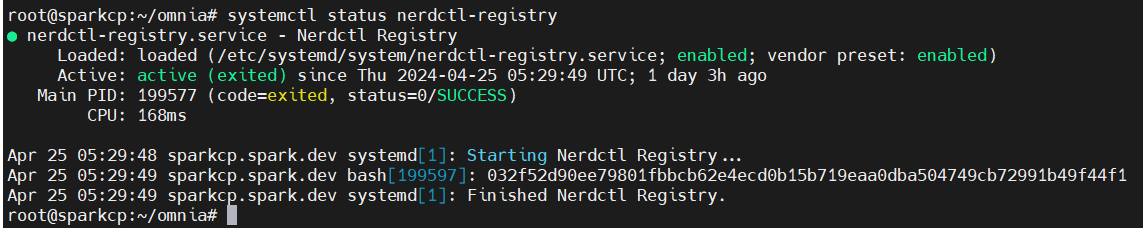
Else run:
systemctl restart nerdctl-registryRun the following command:
nerdctl ps -a | grep omnia-registryExpected output:

Else run:
systemctl restart nerdctl-registryRun the following command:
curl -k https://<OIM_hostname>:5001/v2/_catalogExpected outputs:
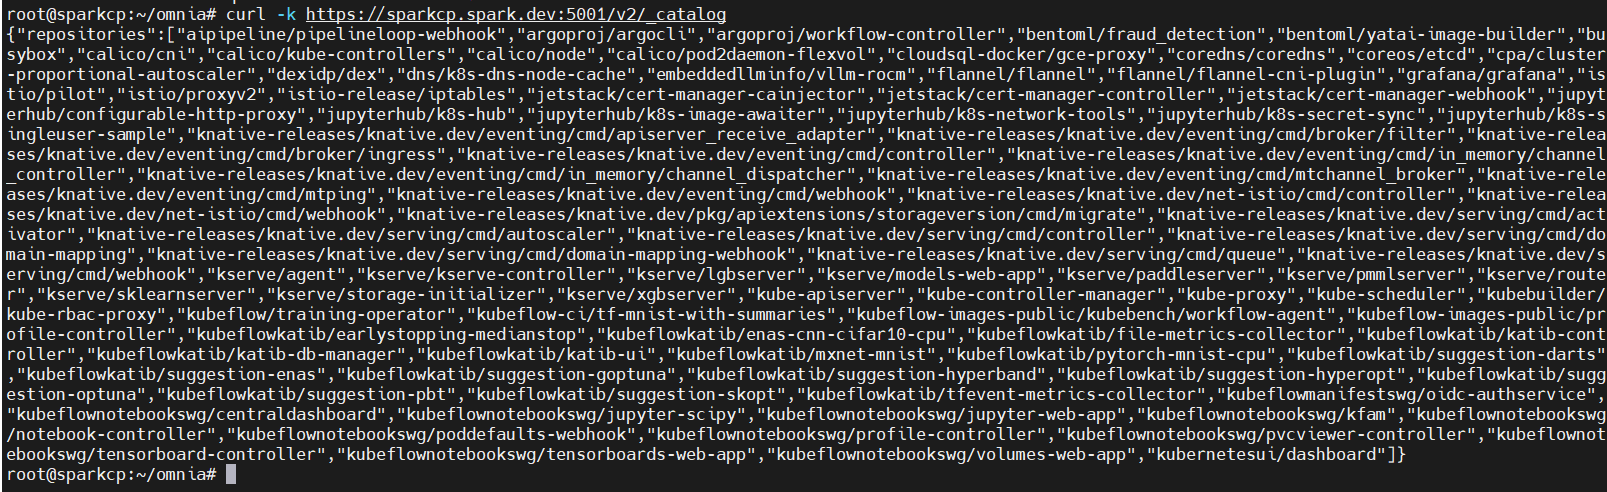
Empty list
Else, do the following:
Restart the OIM and check curl command output again.
Re-run
local_repo.yml.Run the following command:
openssl s_client -showcerts -connect <OIM_hostname>:5001Expected output:
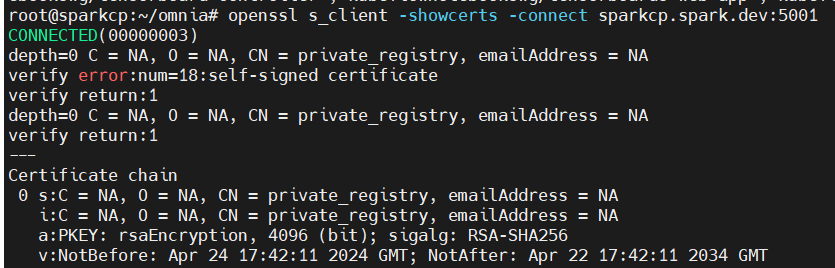
Verify that the certificate is valid and
CN=private_registry.Certificate shown by this command output should be the same as output present at
/etc/containerd/certs.d/<OIM_hostname>5001/ca.crt.If no certificate is visible on screen, run the following command:
systemctl restart nerdctl-registry
Troubleshooting task failures during omnia.yml playbook execution
During the execution of the omnia.yml playbook, if a task fails for any host listed in the inventory, it has the potential to trigger a cascading effect, leading to subsequent tasks in the playbook also failing.
In this scenario, the user needs to troubleshoot the initial point of failure, that is, the first task that failed.
If you have any feedback about Omnia documentation, please reach out at omnia.readme@dell.com.