Acquiring telemetry data for iDRAC and Omnia
Using Texas Technical University data visualization lab, data polled from iDRAC and Slurm can be processed to generate live graphs. These Graphs can be accessed on the Grafana UI.
Once discovery_provision.yml is executed and Grafana is set up, use telemetry.yml to initiate the Graphs. Data polled via Slurm and iDRAC is streamed into internal databases. This data is processed to create parallel coordinate graphs.
Note
This feature only works on nodes using iDRACs with a datacenter license running a minimum firmware version of 4.0.
To access the grafana UI:
Find the IP address of the Grafana service using
kubectl get svc -n grafana
Login to the Grafana UI by connecting to the cluster IP of grafana service obtained above via port 5000. That is
http://xx.xx.xx.xx:5000/login
Enter the
grafana_usernameandgrafana_passwordas mentioned ininput/telemetry_config.yml.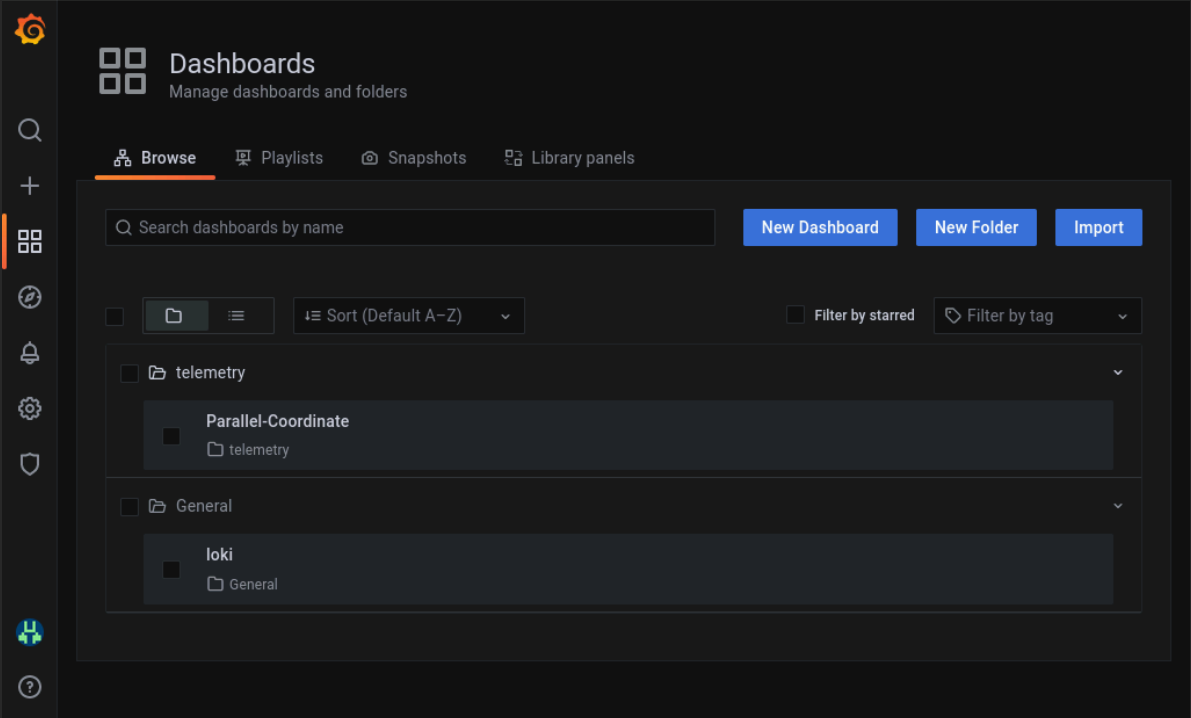
All your data in a glance:
If idrac_telemetry_support and visualisation_support is set to true, Parallel Coordinate graphs can be used to view system statistics.
Note
The timestamps used for the time metric are based on the timezone set in input/provision_config.yml. In the event of a mismatch between the timezone on the browser being used to access Grafana UI and the timezone in input/provision_config.yml, the time range being used to filter information on the Grafana UI will have to be adjusted per the timezone in input/provision_config.yml.
If you have any feedback about Omnia documentation, please reach out at omnia.readme@dell.com.