OIM logs
Caution
It is not recommended to delete the below log files or the directories they reside in.
Note
Log files are rotated periodically as a storage consideration. To customize how often logs are rotated, edit the
/etc/logrotate.conffile on the node.If you want log files for specific playbook execution, ensure to use the
cdcommand to move into the specific directory before executing the playbook. For example, if you want local repo logs, ensure to entercd local_repobefore executing the playbook. If the directory is not changed, all the playbook execution log files will be consolidated and provided as part of omnia logs located in/var/log/omnia.log.
Loki logs
Almost all log files can be viewed using the Dashboard tab (  ) on the Grafana UI. Below is a list of all logs available to Loki and can be accessed from the dashboard:
Name |
Location |
Purpose |
Additional Information |
|---|---|---|---|
Omnia Logs |
/var/log/omnia.log |
Omnia Log |
This log is configured by Default. This log can be used to track all changes made by all playbooks in the omnia directory. Note User can view the combined logs for |
Accelerator Logs |
/var/log/omnia/accelerator.log |
Accelerator Log |
This log is configured by Default. |
kubespray_telemetry Logs |
/var/log/omnia/kubespray_omnia.log |
Kubespray Telemetry Log |
This log is configured by Default. |
Network Logs |
/var/log/omnia/network.log |
Network Log |
This log is configured by Default. |
Platform Logs |
/var/log/omnia/platforms.log |
Platform Log |
This log is configured by Default. |
Provision Logs |
/var/log/omnia/provision.log |
Provision Log |
This log is configured by Default. |
Scheduler Logs |
/var/log/omnia/scheduler.log |
Scheduler Log |
This log is configured by Default. |
Security Logs |
/var/log/omnia/security.log |
Security Log |
This log is configured by Default. |
Storage Logs |
/var/log/omnia/storage.log |
Storage Log |
This log is configured by Default. |
Telemetry Logs |
/var/log/omnia/telemetry.log |
Telemetry Log |
This log is configured by Default. |
Utils Logs |
/var/log/omnia/utils.log |
Utils Log |
This log is configured by Default. |
Cluster Utilities Logs |
/var/log/omnia/utils_cluster.log |
Cluster Utils Log |
This log is configured by Default. |
syslogs |
/var/log/messages |
System Logging |
This log is configured by Default. |
Audit Logs |
/var/log/audit/audit.log |
All Login Attempts |
This log is configured by Default. |
CRON logs |
/var/log/cron |
CRON Job Logging |
This log is configured by Default. |
Pods logs |
/var/log/pods/ * / * / * log |
k8s pods |
This log is configured by Default. |
Access Logs |
/var/log/dirsrv/slapd-<Realm Name>/access |
Directory Server Utilization |
This log is available when FreeIPA or 389ds is set up ( ie when enable_security_support is set to ‘true’). |
Error Log |
/var/log/dirsrv/slapd-<Realm Name>/errors |
Directory Server Errors |
This log is available when FreeIPA or 389ds is set up ( ie when enable_security_support is set to ‘true’). |
CA Transaction Log |
/var/log/pki/pki-tomcat/ca/transactions |
FreeIPA PKI Transactions |
This log is available when FreeIPA or 389ds is set up ( ie when enable_security_support is set to ‘true’). |
KRB5KDC |
/var/log/krb5kdc.log |
KDC Utilization |
This log is available when FreeIPA or 389ds is set up ( ie when enable_security_support is set to ‘true’). |
Secure logs |
/var/log/secure |
Login Error Codes |
This log is available when FreeIPA or 389ds is set up ( ie when enable_security_support is set to ‘true’). |
HTTPD logs |
/var/log/httpd/ * |
FreeIPA API Calls |
This log is available when FreeIPA or 389ds is set up ( ie when enable_security_support is set to ‘true’). |
DNF logs |
/var/log/dnf.log |
Installation Logs |
This log is configured on Rocky OS. |
BeeGFS Logs |
/var/log/beegfs-client.log |
BeeGFS Logs |
This log is configured on BeeGFS client nodes. |
Compute Logs |
/var/log/xcat/computes.log |
Logs system messages from all cluster nodes. |
This log is configured by Default. |
Cluster deployment logs |
/var/log/xcat/cluster.log |
Logs deployment messages from all cluster nodes. |
This log is configured by Default. |
Server Network Logs |
/var/log/omnia/server_spec_update.log |
Server network log |
This log is configured by Default. |
Local Repository Logs |
/var/log/omnia/local_repo.log |
Local repository log |
This log is configured by Default. |
Discovery Logs |
/var/log/omnia/discovery.log |
Discovery log |
This log is configured by Default. |
Prepare OIM Logs |
/var/log/omnia/prepare_oim.log |
Preparing OIM log |
This log is configured by Default. |
Tools Logs |
/var/log/omnia/tools.log |
Tools log |
This log is configured by Default. |
Upgrade Logs |
/var/log/omnia/upgrade.log |
Upgrade log |
This log is configured by Default. |
IP Rule Assignment Logs |
/var/log/omnia/ip_rule_assignment.log |
IP rule assignment log |
This log is configured by Default. |
Software Update Logs |
/var/log/omnia/software_update.log |
Software update log |
This log is configured by Default. |
Performance Profile Logs |
/var/log/omnia/performance_profile.log |
Peformance profile log |
This log is configured by Default. |
Benchmark Logs |
/var/log/omnia/benchmarks.log |
Benchmark messages log |
This log is configured by Default. |
Logs of individual containers
A list of namespaces and their corresponding pods can be obtained using:
kubectl get pods -AGet a list of containers for the pod in question using:
kubectl get pods <pod_name> -o jsonpath='{.spec.containers[*].name}'Once you have the namespace, pod and container names, run the below command to get the required logs:
kubectl logs pod <pod_name> -n <namespace> -c <container_name>
Provisioning logs
Logs pertaining to actions taken during discovery_provision.yml can be viewed in /var/log/xcat/cluster.log and /var/log/xcat/computes.log on the OIM.
Note
As long as a node has been added to a cluster by Omnia, deployment events taking place on the node will be updated in /var/log/xcat/cluster.log.
Telemetry logs
Logs pertaining to actions taken by Omnia or iDRAC telemetry can be viewed in /var/log/messages. Each log entry is tagged “omnia_telemetry”. Log entries typically follow this format.
<Date time> <Node name> omnia_telemetry[<Process ID>]: <name of file>:<name of method throwing error>: <Error message>
Grafana Loki
After telemetry.yml is run, Grafana services are installed on the OIM.
Get the Grafana IP using
kubectl get svc -n grafana.Login to the Grafana UI by connecting to the cluster IP of grafana service via port 5000. That is
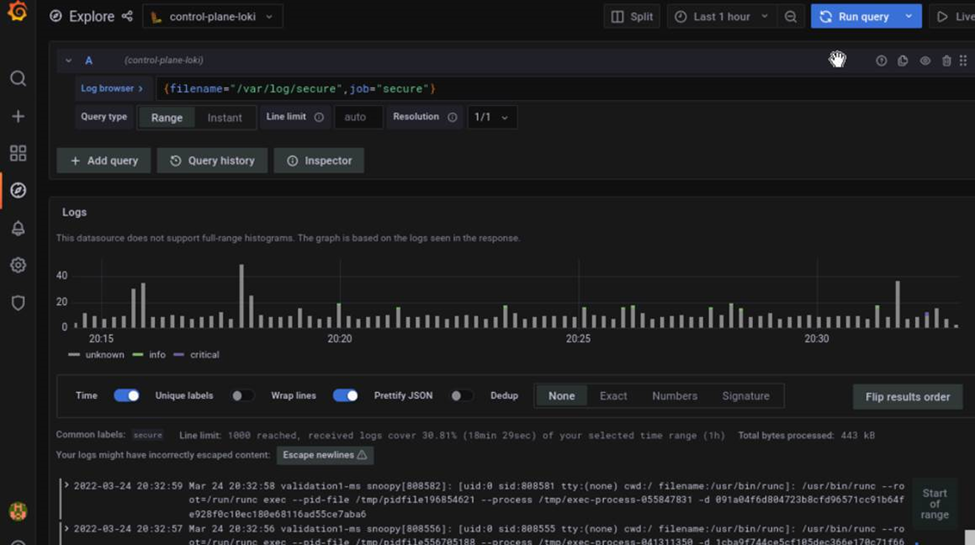
http://xx.xx.xx.xx:5000/login.In the Explore page, select oim-node-loki.
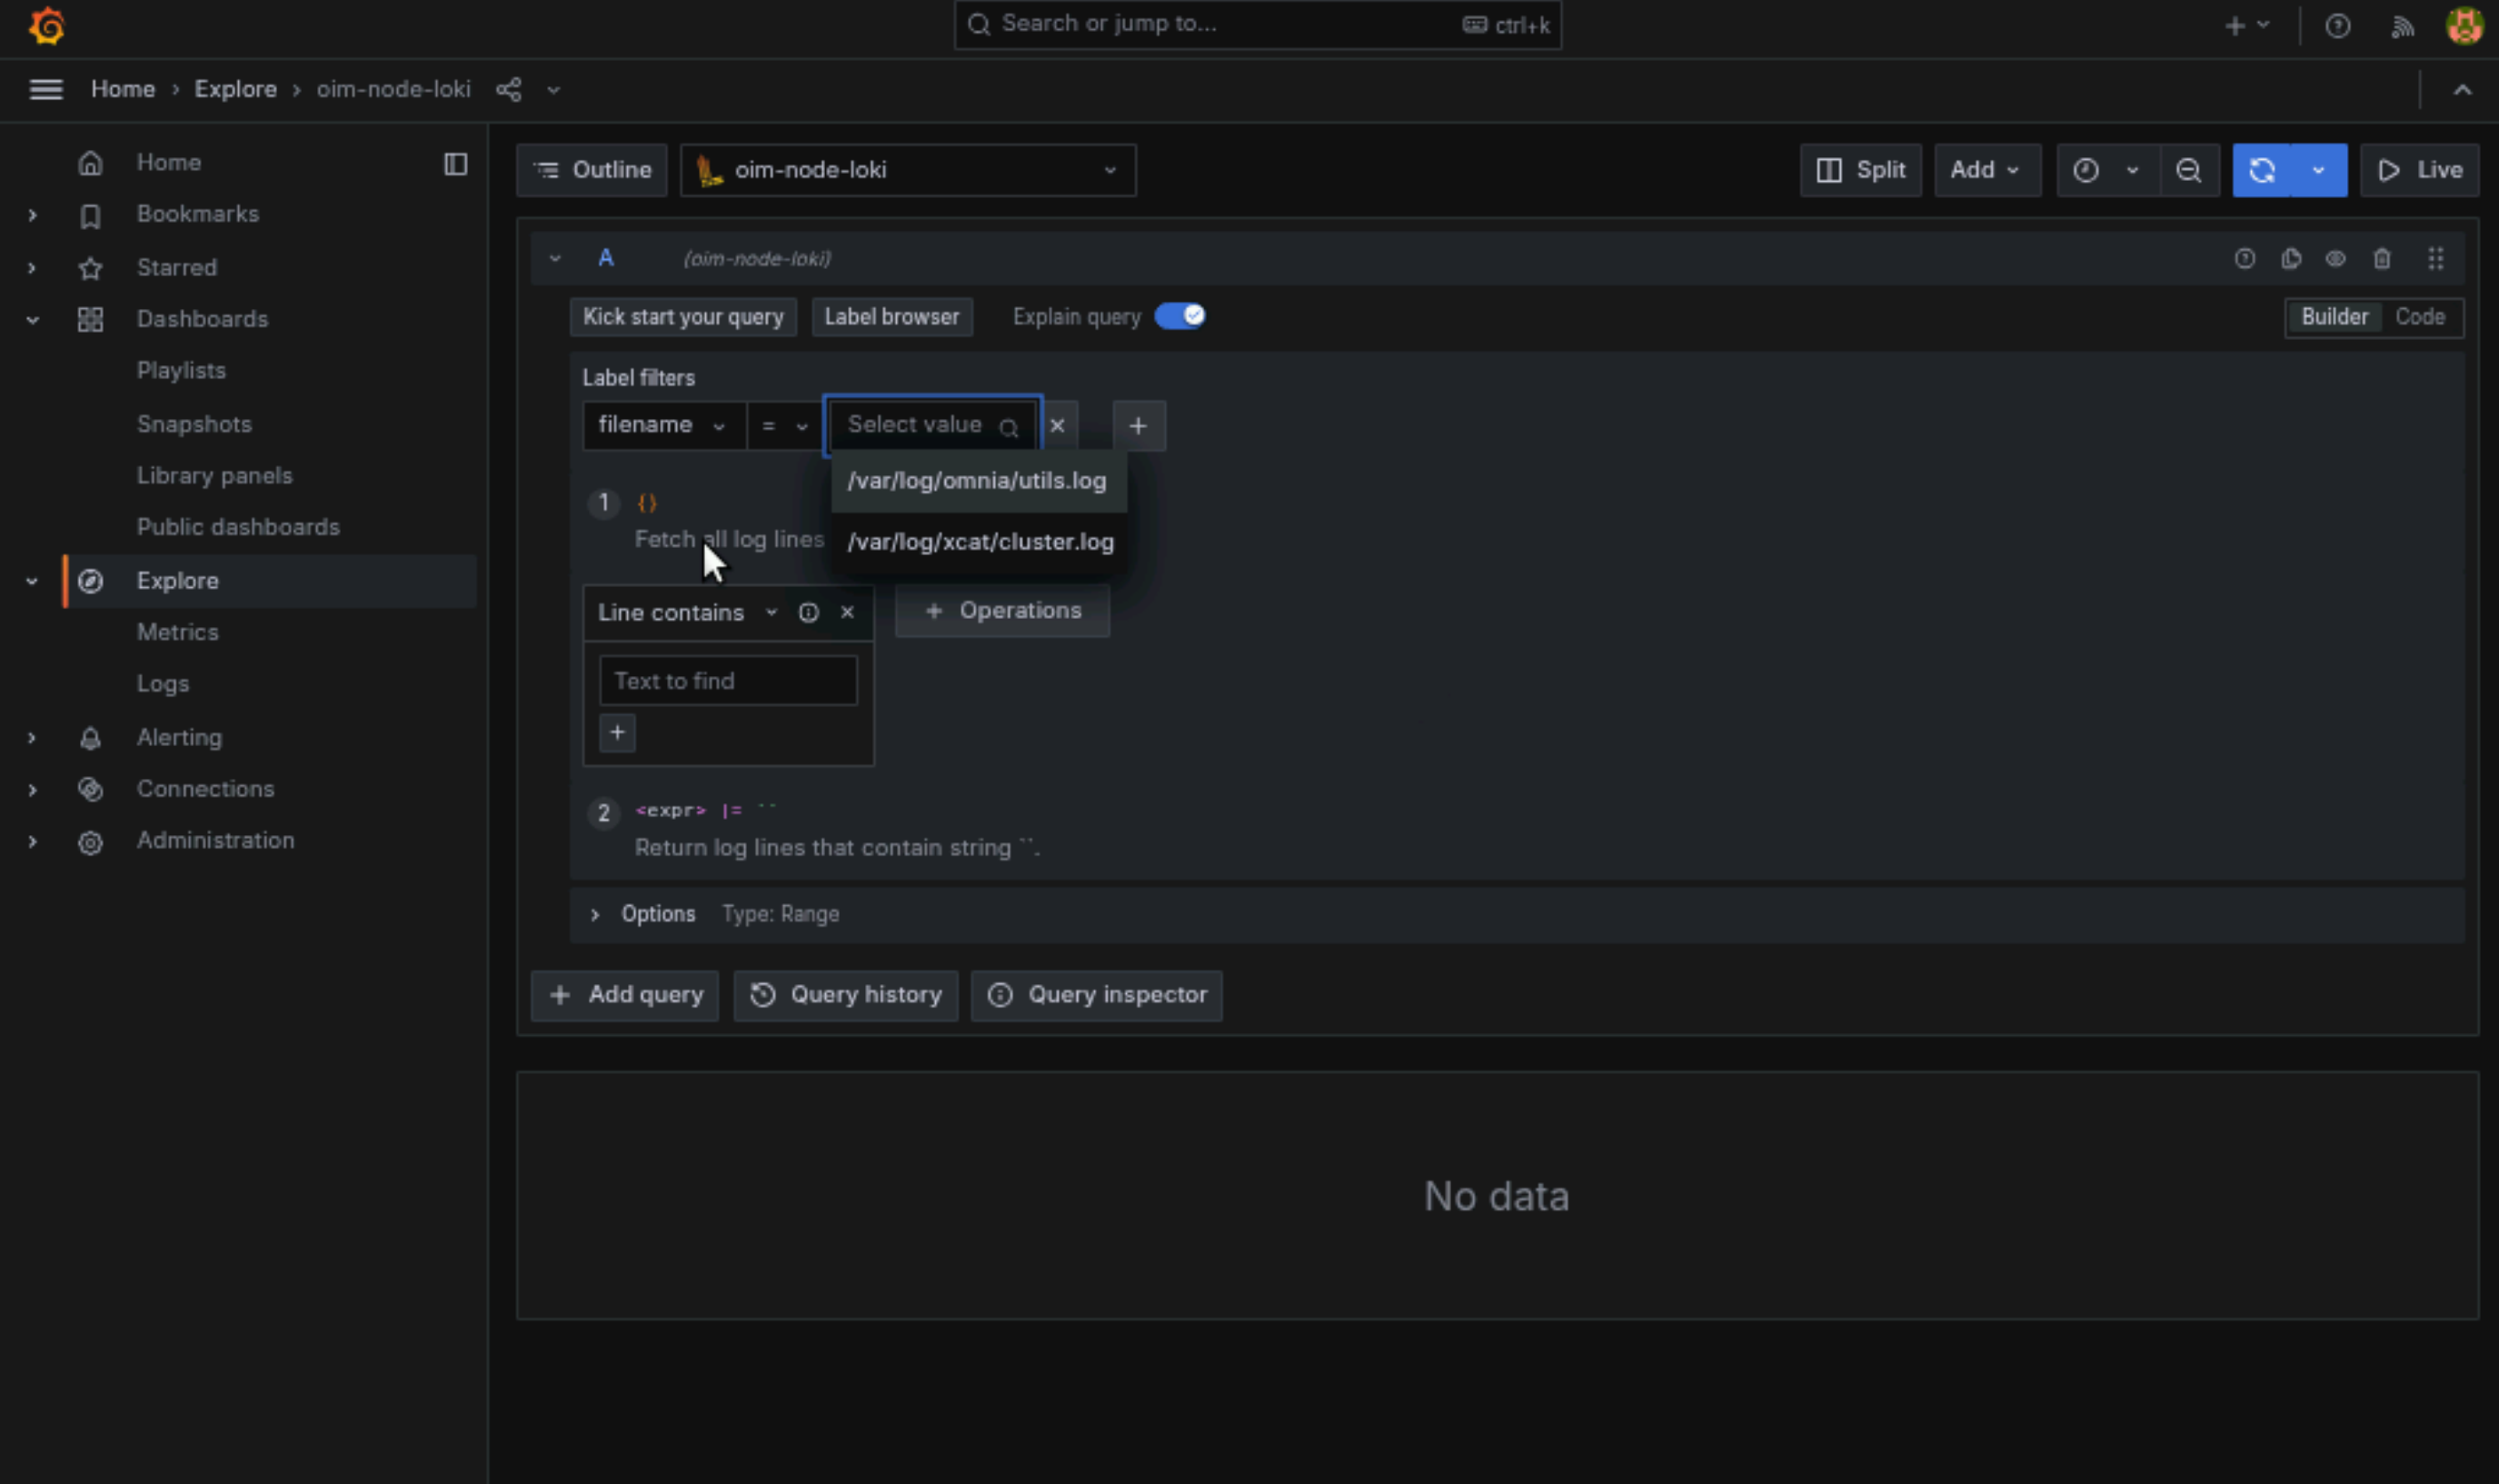
The log browser allows users to filter logs by job, node, user, etc. Example
(job= "cluster deployment logs") |= "nodename"
(job="compute log messages") |= "nodename" |="node_username"
Custom dashboards can be created as per your requirement.
If you have any feedback about Omnia documentation, please reach out at omnia.readme@dell.com.