View the Kubernetes and Intel Gaudi metrics from the Prometheus UI and Grafana
Prometheus metrics visualization refers to the process of displaying the metrics collected by the Prometheus exporter in a visual format, enabling easier analysis and interpretation. Using the Prometheus UI and integration with tools like Grafana, users can create custom dashboards, graphs, and charts to visualize metric trends and monitor system health.
Supported metrics
The list of Kubernetes metrics collected by the Prometheus exporter can be found here.
The list of Intel Gaudi metrics collected by the Prometheus exporter is linked here.
Prerequisites
To view the Kubernetes and Intel Gaudi metrics from the Prometheus UI, the
k8s_prometheus_supportandprometheus_gaudi_supportvariables ininput/telemetry_config.ymlmust be set totrue. All the variables and their related information for the configuration file can be found here.To enable visualization for the supported metrics using Grafana, the
visualization_supportvariable ininput/telemetry_config.ymlmust be set totruein addition to the above mentioned variables.
Execute the telemetry playbook
With the above mentioned variable values provided to the input/telemetry_config.yml file, execute the telemetry.yml playbook using the below command:
cd telemetry
ansible-playbook telemetry.yml -i <inventory filepath>
Note
The provided inventory file must contain a kube_control_plane, single or multiple kube_node, and an etcd node.
Accessing the Prometheus server for Kubernetes and Gaudi metrics
Access the Prometheus server from the kube_control_plane or kube_node
After you have executed the
telemetry.ymlplaybook, run the following command on thekube_control_planeto bring up all the services that are currently running on the Kubernetes cluster:kubectl get svc -A
Locate the
prometheus-kube-prometheus-prometheusservice under themonitoringnamespace. You can access the Prometheus server with the correspondingCLUSTER-IPof the Prometheus service.
Access the Prometheus server from the Omnia OIM
After you have executed the
telemetry.ymlplaybook, run the following command on thekube_control_planeto bring up all the services that are currently running on the Kubernetes cluster:kubectl get svc -A
Locate the
prometheus-kube-prometheus-prometheusservice under themonitoringnamespace.Update the Prometheus service
TYPE:Use the following command to change the Prometheus service type to
LoadBalancerand automatically assign anEXTERNAL-IP:kubectl patch service prometheus-kube-prometheus-prometheus -n monitoring -p '{"spec": {"type": "LoadBalancer"}}'
Or, use the following command to change the Prometheus service type to
NodePort:kubectl patch service prometheus-kube-prometheus-prometheus -n monitoring -p '{"spec": {"type": "NodePort"}}'
To access the Prometheus server from any browser, you can use
<EXTERNAL IP>:9090from the Omnia OIM orkube_control_plane, and<kube_control_plane IP>:<kube_node port>from thekube_node.Once you navigate to
<EXTERNAL IP>:9090from your browser, the Prometheus UI is displayed. A sample image of the UI is provided below: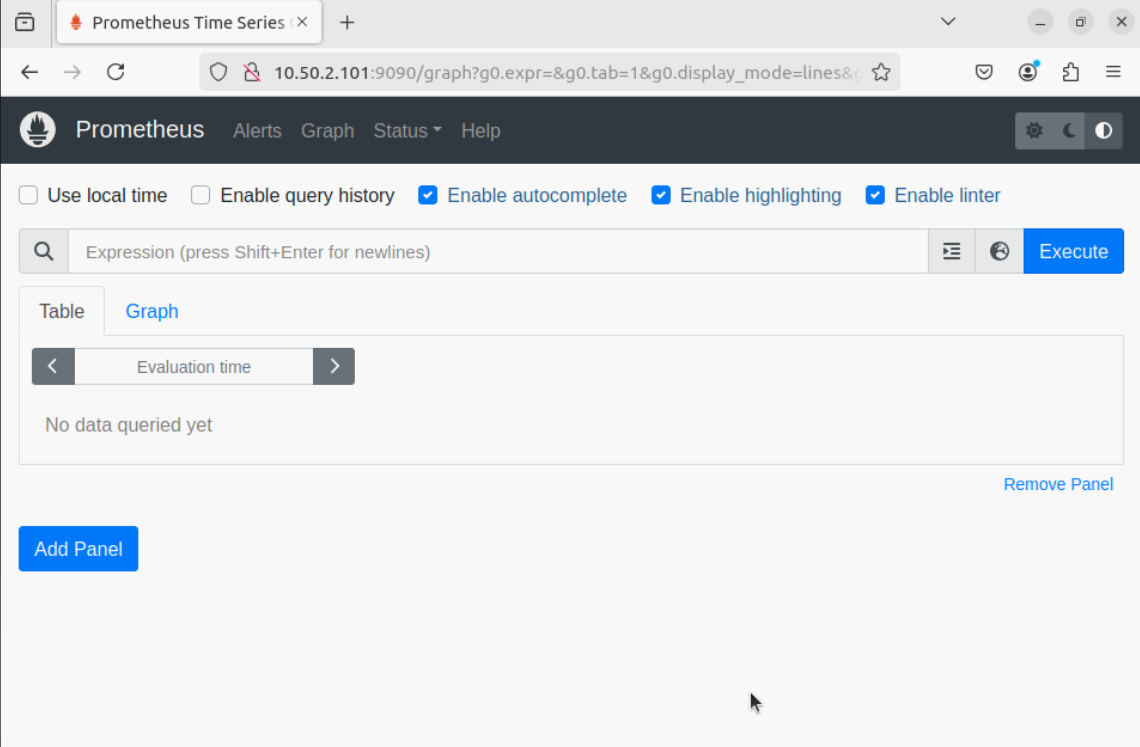
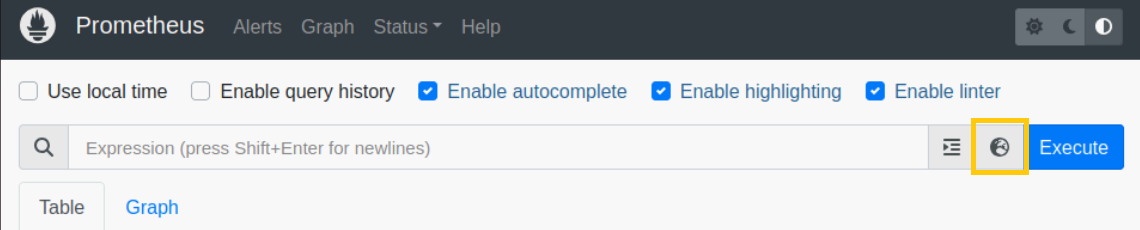
From the UI, you can click the “Globe” button (highlighted in yellow in the following image) to open up the Metrics Explorer.
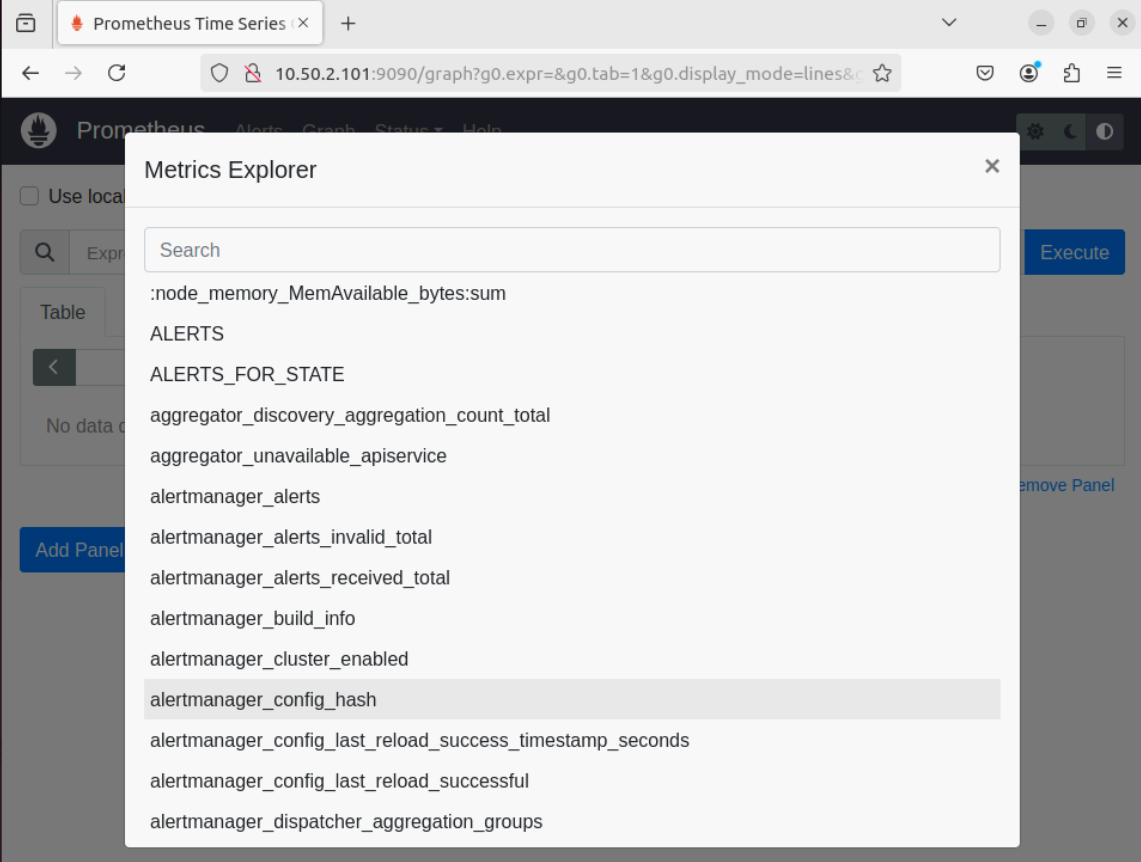
Use the Metrics Explorer to get all the available Kubernetes and Intel Gaudi metrics. A sample image of the Metrics Explorer is provided below:
Visualize the Kubernetes and Intel Gaudi metrics using Grafana
Find the IP address of the Grafana service using
kubectl get svc -n grafana

Login to the Grafana UI by connecting to the cluster IP of grafana service obtained above via port 5000, that’s
http://xx.xx.xx.xx:5000/login

Add the Prometheus data source to Grafana
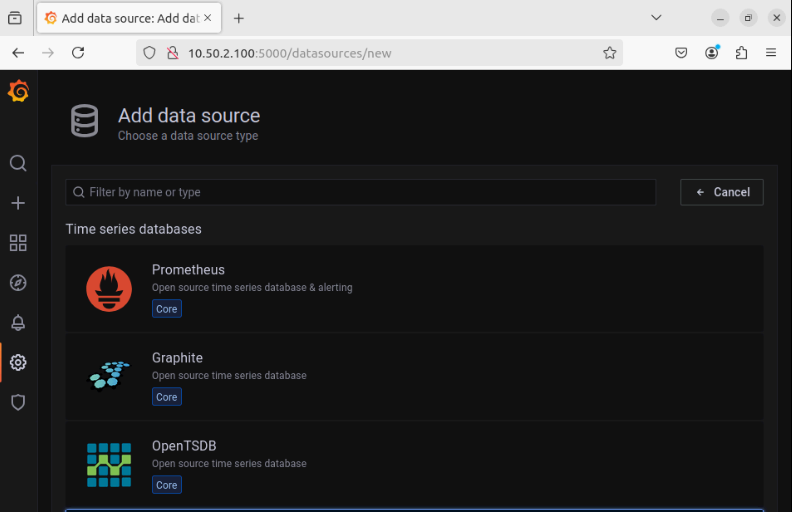
Add the Prometheus server URL to the datasource configuration window, for example -
http://10.50.3.101:9090
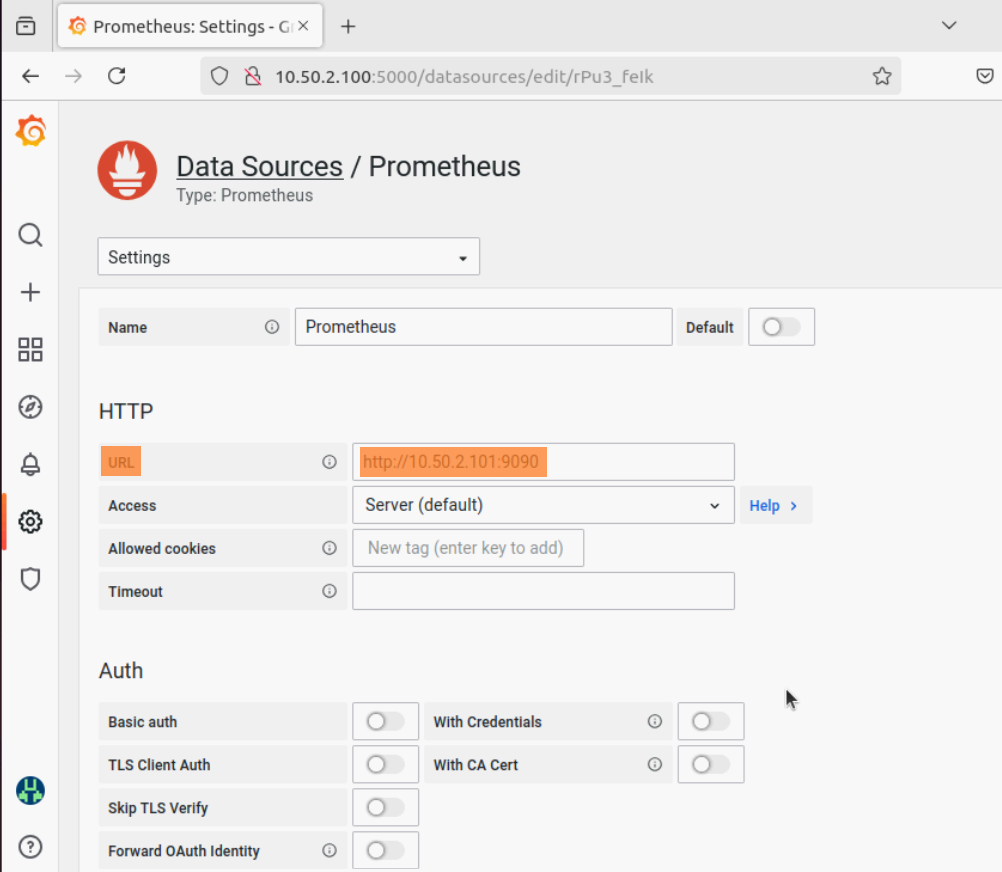
Click
Save & test. A green checkbox pops up signifying successful configuration of the Prometheus datasource.From the dashboard menu on the left, create a dashboard with your own settings or import an existing one from Grafana dashboards. Set the datasource to
Prometheuswhile configuring the dashboard. For more information on how to import dashboards, click hereClick
Loadto bring up the Grafana dashboard with the Prometheus metrics.
If you have any feedback about Omnia documentation, please reach out at omnia.readme@dell.com.